Nifty
Date: 25-Jan-2015
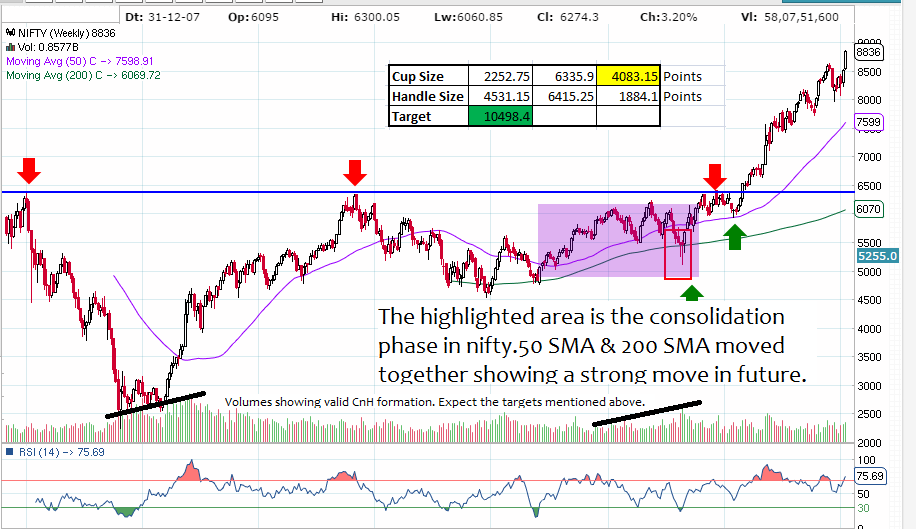
Nifty is pausing for sometime and moving up. However there are small or sudden pull backs, it looks Nifty moving towards its CnH target of approximately 10500. Below is weekly chart depict the Nifty move.
Nifty
Date: 2-Nov-2014
Below chart is Nifty weekly. It looks Nifty reached upper end of the channel completing the third wave. This area looks good to go short for till December Mid. Everyone looks at shorter time frames hourly, daily. Have a look at weekly chart, you see the clear picture of Nifty Move.
Nifty
Date: 26-Oct-2014.
Nifty is in correction after having a wonderful rally.
Below is the daily chart. There are two possibilities currently with Nifty aligned at. Daily chart shows the possibility of another high on market with three wave structure from recent low to complete the expanding triangle in 5th of 3 rd wave.
If we assume that 3rd is already ended with high at 8160 and now we are already in 4th wave correction then we may expect a further down side in the Nifty with formation of A-B-C-X-A-B-C targeting the levels of 74XX marked.
Weekly Chart:
Below weekly chart suggests that the Fibo retracement and channel support are falling at the range of 73XX. Keep adding shorts on every 50 points move for next two months until we see 74XX levels.
Keep a strict SL above 8304.
600 points reward with 300 points SL. Trade peacefully.


Positional traders update your SL to 8350.
ReplyDelete