Nifty
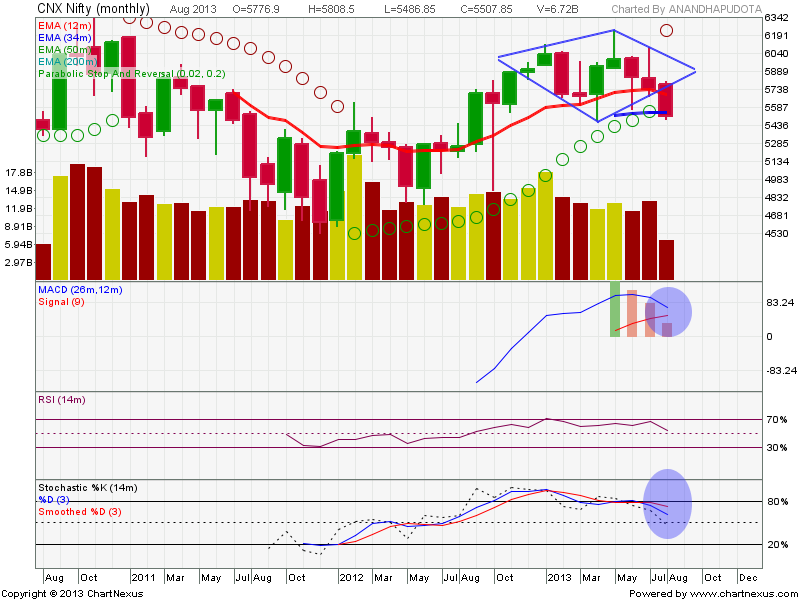
Yesterday I missed to post monthly chart which gave diamond break down. Here it is.A person with minimum knowledge in technical Analysis can make good profits if one stick to the basics. MACD is ready to give bearish sign on Montly charts.
If we draw an upward channel for almost one year rally of Nifty and the downward channel for this year 2013. We see the cluster zone where Nifty can pause for sometime or may see some support in this fall.Below is the chart showing these channels in Blue trend lines.There is previous supports and resistances taken multiple times in the range markets with Black horizontal trend line. The cluster zone as target for this Nifty fall is marked with Blue circle on right side of the chart where M formation will also end and trend lines are clustered.
As expressed in my previous post every raise is a sell on Nifty with a target price of 5145. At least for a range of 5150 to 5160. In process of reaching these targets Nifty MAY pause at intermediate supports at 5360/5270 and have a small pull back so that technicals will adjust and support the fall.
It is advised to traders that be short side in the market which are bearish and trail SL your trades so that you can make good money.
Hourly chart
Hourly chart says that Nifty is moving in a downward channel. It looks like Nifty took trend reversals yesterday in second session. However it could not cross make a new high in last 4 hours of trade before close. Downward channel resistance is falling at 5454 levels on spot Nifty. 12 HEMA is falling at 5470. These two values may act as resistances for tomorrow.Moving past these values may show some positive bias till 34 HEMA @ 5555.
Looking at Fibonacci resistances, for the raise from 5512 to 5764, below values may give resistance as well.
23.6% @ 5571.51
38.2% @ 5608.3
50%@ 5638
Considering the Fall from 5764 to 5360 then below levels may act as support and resistances for the pull back.
23.6% @ 5669
38.2% @ 5610
61.8% @ 5515
76.4% @ 5456


No comments:
Post a Comment