Saturday, March 22, 2014

India VIX

India VIX

India Vix is trading in a traingle for longer time. It hit earlier low of 12.50 and recorded a new low.For almost 6 months VIX is resisted by trend line. Posted earlier also using this trend which is not yet broken till now and hence Nifty is Kept trading at higher levels. Looking at daily charts, still the Vix can be at these lower levels with chances of hitting low once again. Keenly watch this to give a breakout for any bearish view. If Vix moves lower to 12 then there is a chance that it may go all the way to 8 to 7.

Wish you happy trading and Investing.

my strategy is to sell options when VIX is at low ( or making lows in the month) Buy options when it aligned to move up. All the best.


Thursday, January 30, 2014

India VIX

India VIX

Below chart is of India VIX.

VIX was trading in very narrow range for most of the time in January. Nifty options buyers would not have seen much profits as time would have eaten up the premiums they paid up. Now VIX came out of the narrow range trading. However it is resisted by a trend line where VIX faced resistance twice in 5 months. Nifty also made first swing low after 5 months. From last 5 months, Nifty is making Higher Lows. First time we Nifty made a Swing low after 5 months.

If at all Nifty break out of this trend line, we will be seeing huge volatility in markets.When there is a volatility in markets, it is good to trade in options.Watch VIX carefully and up on breaking out of this range, use option strategies to gain more out of this awaiting volatility.

Good Luck !
Happy Trading !


Saturday, January 18, 2014

Nifty


Its been long time something is written here. I will try to update Nifty move regularly.
In below chart Nifty is moving completely in sideways manner with good swings in both the sides. Being expiry is near in 2 weeks, Nifty may not move much in one direction. Nifty chart below shows that It is moving in a triangular formation from last 2 months as shown in WHITE Trend lines.Support for Nifty at bottom trend line is falling at around 6200 levels.

If you look at the Nifty movement using Pitchfork lines, There are different swings where we can apply this analysis. But I'm majorly considering below formations. With more data points from the highs of 6480 on 9th of December 2013 to 6157 on 10th Jan 14, ( shown in RED DOTTED lines), Nifty exactly landed on support line which is falling around 6245 to 6250 levels.If nifty could not break this level on Monday or Next week, there is a possibility that Nifty can move upward from here on. If breaks this levels, then there is another pitch fork line which is falling at 6225 range formed while connecting two points with high at 6408( on 2nd Jan 14) and Low of 6157 (on 10th Jan 14).

If at all Nifty breaks these two levels of support then we may see support at the trend line forming triangle as mentioned above shown with White trend lines in chart falling at 6200.

New method Trend Reversal posted in another blog at 

Trade with confidence in Technical Analysis


says that Nifty took reversal at 6408 on 2nd Jan'14.  If this correction gives a buy trend reversal with Higher support at Nifty and RSI making low, one can go long at support levels discussed above and trade for good up move.


Also note that the current levels 6250 are falling at 50% of retracement of Nifty for the raise from 6408 to 6351. So there is a possibility that Nifty can find support either at these levels or at 61.8% ( @ 6228 ) which is also the pitch fork support line ( mentioned in Blue dotted line). So trade with caution and make entry with minimal SL so that you can make good profits.


Tuesday, September 3, 2013

Nifty


Nifty

Nifty is trading in a broader range daily moving 100 to 210 points. Giving good opportunity to traders. Today one of my friend said he is pity on those who do not use SLs in their trade. Yes, if at all they take counter trend trades without SL, we have to be pity on them. India VIX is hovering above 25 and Nifty is trading in a good range where traders can use the opportunity to make good money.  Earlier we posted on Nifty with different time frames of

1. Monthly Diamond Break down bearish pattern
2. Pitch Fork target prices.

In earlier down move, all price target range were met during those time frames. Even in this pull back till yesterday morning first few minutes, we were given target using Expanding triangle pattern when it broke up the channel in which it was travelling earlier. Below are few charts which I was sharing with my near and pear group.


Now I relabeled all EW counts and feel there is more down side in Nifty. Nifty is forming a very rare formation that is triangle formation in 2nd wave of Impulsive 3rd wave C. This formation is very rare in technical EW.  Refer the NCNIFTY_EW_Alternative.

Refer the link here. [Although upon extremely rare occasions a second wave in an impulse appears to take the form of a triangle, triangles nearly always occur in positions prior to the final actionary wave in the pattern of one larger degree]

 Here is the current view of the Nifty with clear labeling. We will see the Nifty move from here on follow strictly. Looking at the current momentum in Nifty it looks it resumed its impulsive nature with its down trend and moving downwards. If that is correct we consider todays fall as impulsive move (iii) rd wave of 3rd wave of C after completion of rare formation expanding triangle of (ii) wave of 3rd of C.


Tomorrows follow up actions and further moves of nifty have to confirm this from here on.


Andrew Pitch Fork:

Looking into the swing moves on Nifty 4 hour charts, Nifty clearly failed to hit the targets of pull back for the swing 6093 to 5118 levels  at around 5635 levels which is a clear sign of bearishness. Earlier also we posted analysis on Nifty with Pitch Fork lines where it failed upside which pulled down the nifty drastically.


Looking into current swing from 5118 to 5580.95 and looking at the targets as per Andrew Pitch Fork lines, targets are falling at below 5175 levels. If EW labeling show above is correct then these targets are easily attainable.


If we look at the supports that Pitch Fork lines can give are the line of the previous Pitch Fork lines which are falling at around 5233.Moving below these lines may warning signal for further correction.


Looking at EMAs.

As expected 34 EMA resisted the move of Nifty and we saw a correction of more than 200 points with Market depth of 250 points. At some point we felt that 12 EMA may give support. But Nifty decided to see lower levels it seems so it could not wait in that range corrected sharply with good volumes. Due the recent rally all indicators are adjusted so that they can provide enough space for Nifty to see more lower levels.
Todays close also below the DLwEMA which signifies the bearishness in the market.

Trade with support and resistance levels in mind. Keep trailing SL is your girl friend along with your fried trend. So keep doing good and happy trading day.

If any pull back seen towards 12 EMA ( for today at 5442) can be used as shorting opportunity with SL above 34 EMA.

As per PSAR on daily charts 5158 seems to be support or trend reversal point.


Sunday, August 25, 2013

Nifty

Nifty 

Nifty Nifty Nifty... Everyone eyes on Nifty. People who are good in markets say Nifty have resistance here and support here. If moves above this Nifty visit these levels. Otherwise Big bhom. blah blah.....

People who are not good at market analysis says Market down by XX points.This week market has fallen some XXX points.

Lets see what technicals are speaking about Nifty.

Daily Chart:

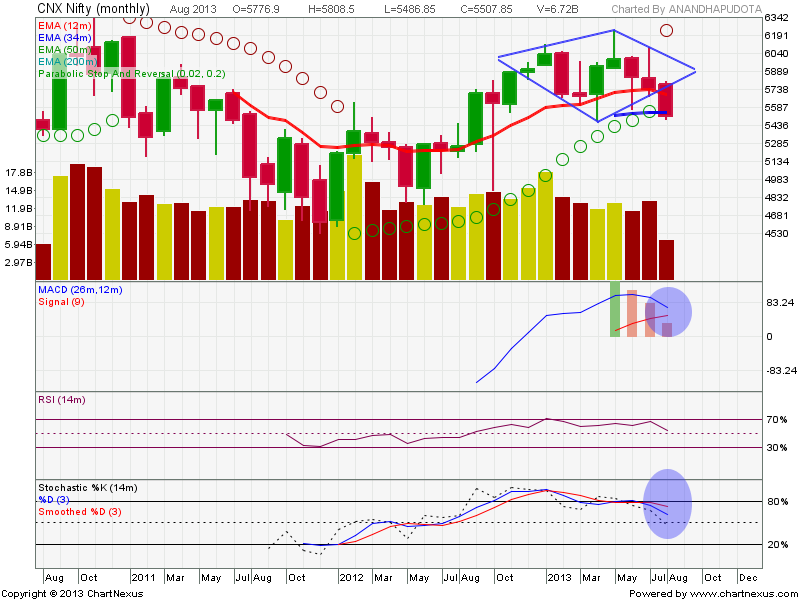
Nifty daily chart shows Nifty found support at 5270 levels and bounced back. Nifty is moving in an upward channel for more than a year which is shown in RED trend lines. This channel gave support for the Nifty and Nifty moved up from the channel bottom. Nifty made a lower low by touching 5268 levels showing some weakness.

There are two downward channels in which Nifty is moving on daily charts. One( Brinjal colored channel) started at starting of the year and another(Blue channel) one started in 2 months ago. However Nifty shows that there is trend(Blue channel top) line resistance @ 5550 levels.

RSI seems to be turning down. We can not pressume anything unless price action confirms this.

If Nifty have to confirm its down trend we expect Nifty to find support at bottom of the downward channel around 5190 - 5050 levels marked with Red Circle

If the blue trend line is broken we see next resistance is coming at around 5703 levels.


Using Andrew Pitch fork on Hourly charts,(From GCI MT4 data) Considering the swing high as 5754 and low as 5246.Target would be 5476 which was achieved almost last Friday. Secondly, if we try considering the swing low as 5246 and Swing high as Fridays High 5476 then the target should be 5280.


Suppose if we consider the swing high as 6093 and swing low as 5246 and then the target for this up move would be 5704. This will be confirmed once the Nifty crosses 5550 and stays above.


Intraday chart:

Nifty is still moving in a downward channel.Channel top being around 5620 levels. Chart included Pre open data.From last two days Nifty is moving with mild bullish sentiment and moving in an upward channel. Nifty seems to be at the top end of the channel and bottom is falling around 5360 levels. After having 2 days of rally, Nifty no where giving any kind of -ve divergence to expect a fall. So Nifty may still continue upmove. But Price action anytime may move so that techncicals will adjust.


Nifty predictive move could be formation of HnS pattern. Suppose if Nifty found a resistance at 5504 levels and correct, we may see support at 5364 /5280 levels from which Nifty may bounce back to see sharp up move if at all Nifty feel like rallying. Otherwise, It may visit the bottom of the channel shown in daily charts below 5200
.


EW Lables:

Considering the EW labels. Nifty looks in 2nd wave of 3rd of C if C is in 5 wave structure. Looking for 3rd wave target at 5150 levels.2nd wave of 3rd of C almost pulled back till 1st of 3rd of C which is almost 100% if Nifty see 5504 levels. Nifty moving above this level invalidates that the Nifty is in 3rd wave of C.
EW says that there is a chance that the Nifty may visit the bottom of the downward channel around 5150 - 5005 levels.


So lets trade on Nifty holding 5400 for bullish side and breaking below 5345 bearish side.

Please note that I have been giving a warning for options traders to be cautious due to expected volatility.

Happy trading day.


.

Tuesday, August 20, 2013

Nifty

Nifty

 Hourly chart is still in channel. Now at channel top. Nifty made high of 5417.90 which is 23.6% of the fall from 5754 to 5308. If this is the maximum pull back market can give for the fall. EW says the next down is going to be very strong. Suppose if Nifty moves from here on upside. Maximum it can go up to 5465 which is channel( downward channel broke down yesterday) retests.

Lets cross our fingers and wait for market move tomorrow. SGX nifty give a sense of move at 8:45 AM tomorrow. Also pre opening as well. Considering the festive season tomorrow, expecting less participation in the market. If at all the expected Fed new tomorrow gonna bad, our markets may predict even before results and continue correction as mentioned above. 
Nifty is still in the channel. At the top end of the channel. Now Nifty made insider candle with bearish flag set up. The retrace is till 23.6% which is worrying fact. It would have retrace little more than that so that we will be thinking of bullishness. This is one way of bearish outlook analysis. 
If we look at 12 EMA and 34 EMA on hourly charts, they both turning flat which signifies the short term pause. Untill they both converge together there is a chance that Nifty will trade flat or move a little higher. 12 HEMA @5407 and 34 HEMA @ 5485. There is a chance that Nifty may move higher and touch the 34 EMA and correct if moves past 12HEMA. 
In hourly,Stochastic could not move past 80. turned down and crossed.RSI also looks turning down. 
Moving above 5420 can take it to 5485 which is 34 HEMA. You are seeing only narrow range made. Conisdering the earlier fall along with this narrow range, you see bearish pattern. Fall could be same as pole length.
Today BankNifty helped Nifty to hold back 
EW says that now Nifty is in 2nd of 3 rd of C. I believe if 2nd will be completed at around 5465 - 5485 which may happen in Gap up or due to festive mood by EOD tomorrow if less participation is seen.
a. 5307.60 - 5417.65 = 110.05
b. 5417.65 - 5356.35 = 61.3
c. 5356.35 - 5416.35 = 60 for now
If at all a=c then c should end at around 5356.35+110.05 = 5465 approximately. If extends may be seen 5480 where 34 HEMA resists. We have to wait and see whether this comes in GAP up opening or slow move.

Monday, August 19, 2013

Nifty

Nifty

Yesterday I missed to post monthly chart which gave diamond break down. Here it is.A person with minimum knowledge in technical Analysis can make good profits if one stick to the basics. MACD is ready to give bearish sign on Montly charts.


If we draw an upward channel for almost one year rally of Nifty and the downward channel for this year 2013. We see the cluster zone where Nifty can pause for sometime or may see some support in this fall.Below is the chart showing these channels in Blue trend lines.There is previous supports and resistances taken multiple times in the range markets with Black horizontal trend line. The cluster zone as target for this Nifty fall is marked with Blue circle on right side of the chart where M formation will also end and trend lines are clustered.

As expressed in my previous post every raise is a sell on Nifty with a target price of 5145. At least for a range of 5150 to 5160. In process of reaching these targets Nifty MAY pause at intermediate supports at 5360/5270 and have a small pull back so that technicals will adjust and support the fall.

It is advised to traders that be short side in the market which are bearish and trail SL your trades so that you can make good money.


Hourly chart

Hourly chart says that Nifty is moving in a downward channel. It looks like Nifty took trend reversals yesterday in second session. However it could not cross make a new high in last 4 hours of trade before close. Downward channel resistance is falling at 5454 levels on spot Nifty. 12 HEMA is falling at 5470. These two values may act as resistances for tomorrow.Moving past these values may show some positive bias till 34 HEMA @ 5555.

Looking at Fibonacci resistances, for the raise from 5512 to 5764, below values may give resistance as well.
23.6% @ 5571.51
38.2% @ 5608.3
50%@ 5638

 Considering the Fall from 5764 to 5360 then below levels may act as support and resistances for the pull back.

23.6% @ 5669
38.2% @ 5610
61.8% @ 5515
76.4% @ 5456